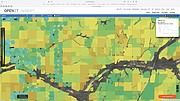
On the map: Open source technology lets farmers conserve precious water
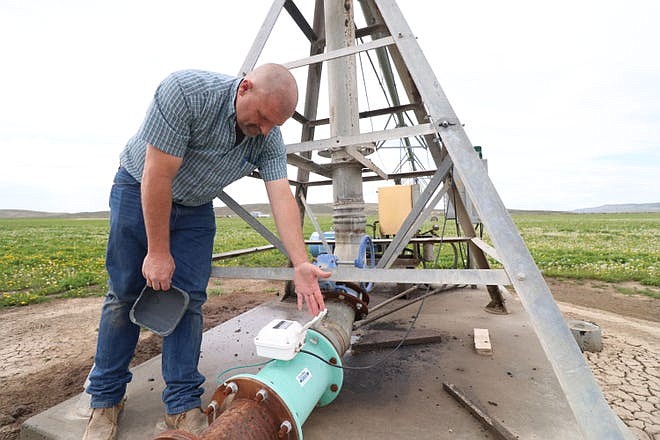
CRANE, Ore. — Mark Owens said his desire to conserve water began in earnest way back in 2015.
Owens, an alfalfa grower and member of the Oregon state Legislature representing its 60th district, had, along with a number of other farmers in Eastern Oregon’s Harney Valley, signed up to participate in U.S. Geological Survey study of groundwater use in the region when officials who oversee the state water program gave them some bad news.
“The Water Resource Department came into our basin and said, ‘Hey, we might have over-allocated your basin. We’re not going to process any new permits,’” Owens explained. “That was kind of concerning to a lot of us.”
State water allocations in a dry, eastern part of a state matter. So a lot was riding on what the USGS was doing, Owens said, when they learned something interesting.
“And as the groundwater study proceeded, we found out that one of the big data points they did not have was the amount of water that was actually being applied for consumptive use,” he explained.
So, Owens asked — how could they figure out just how much water was being used for irrigation in the Harney Basin?
“That’s when I started looking at OpenET or evapotranspiration, trying to figure out what water does my crop need,” Owens said.
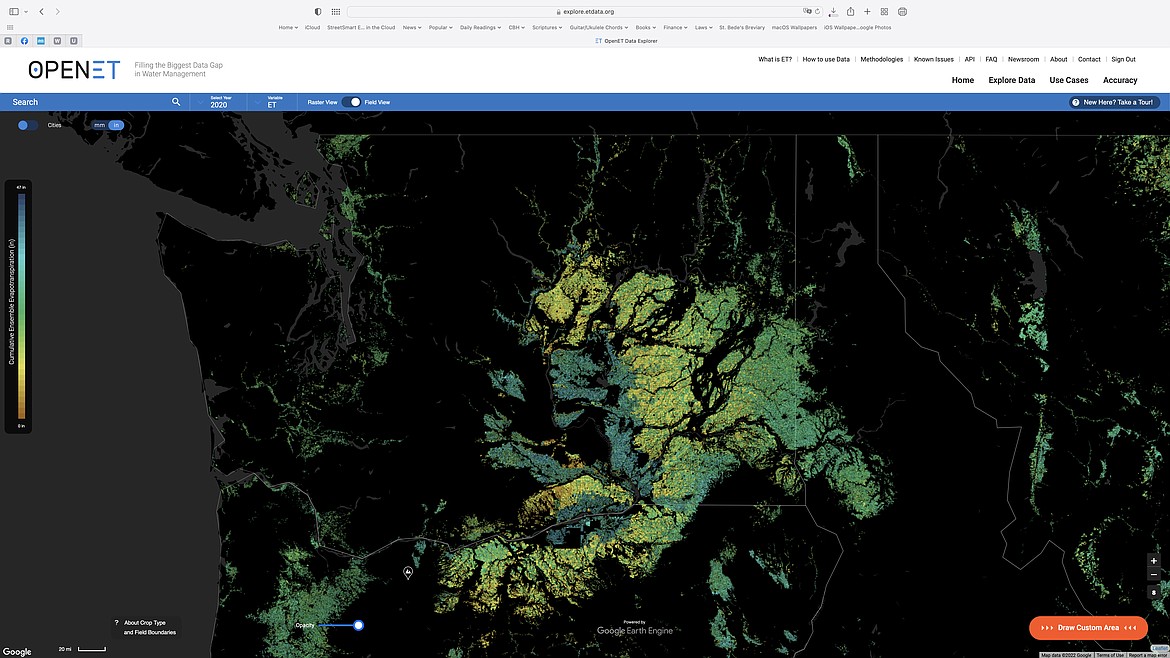
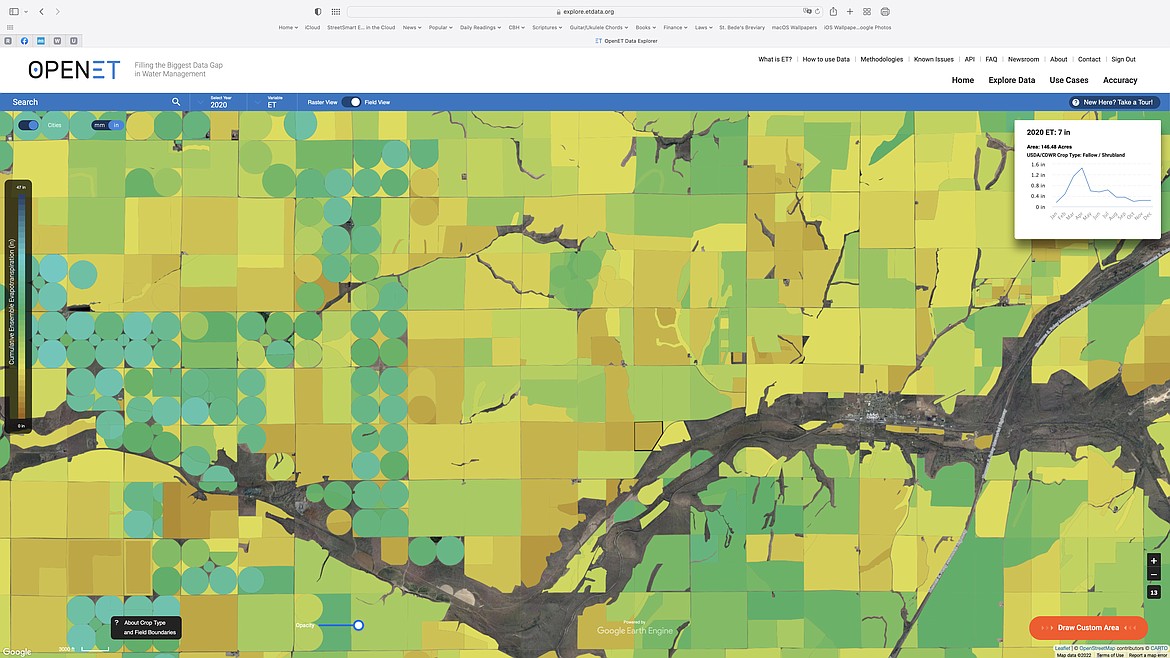
OpenET is an open source website that tracks and displays evapotranspiration data from farm fields in 17 western states — roughly the entire country west of the 100th meridian in what was, in the 19th century, called “The Great American Desert.” A collaboration by the Environmental Defense Fund, Google, NASA, the USGS, USDA’s Agricultural Research Service, the Nevada-based Desert Research Institute (DRI) and several major research universities including the University of Idaho and the University of Nebraska-Lincoln, OpenET provides information gathered by earth-orbiting satellites in the Landsat program as well as ground sensors, matches it with USDA and USGS geographic data on actual fields, and then displays information on how much water is evaporated by the crops grown in the field.
Evapotranspiration is the term used to describe the way water moves through plants from the soil, up through the roots and into leaves, where it’s used by chlorophyll cells with sunlight and carbon dioxide to create simple sugars, producing oxygen molecules and some water.
The water then evaporating off the leaves of crops like wheat, alfalfa and potatoes (or any plant, really) can easily be measured by satellites like Landsat 8 and Landsat 9 (which orbit the Earth at an altitude of around 450 miles), which is then used to build mathematical models designed to forecast future water use, according to DRI researcher Matt Bromley.
“The satellites capture a variety of data, everything from optical, what your own eye would see, as well as temperature data,” said Bromley, who has been using satellite data to study water usage for the last decade. “And so with that data, we can detect signals from the vegetation in terms of how green they are picking up measurements or relationships with chlorophyll.”
According to Rachel O’Connor, a senior analyst at the Environmental Defense Fund, OpenET gives farmers like Owens the ability to see just how much water their crops use, and adjust their irrigation practices accordingly.
“It actually puts that data in the hands of the growers, because they’re the ones that are most capable of making the decisions of how to manage their fields,” she said.
Once he started looking closely at how his crops used water, Owens — who got early access to the site, and has been testing some new tools under development — said he was able to reduce irrigation on some of his fields by upwards of 25%, O’Connor said.
“By being able to see in near real time, what the water consumption for his crops was. And that actually also resulted in some significant cost saving for him, because by reducing his total water pumpage, he’s also reducing his electricity needs,” she added.
In fact, Owens said he redesigned his irrigation system to actually put out less water.
“Why aren’t we designing our system to put 18 to 20% less water out if that’s the savings you have? We like things to be the easiest to manage as possible,” he said.
Currently, access to the OpenET website is free, and anyone can register and sign up at openetdata.org to look at what they’ve got. The evapotranspiration data can be viewed either per delineated field — using USDA and USGS data — or in combination with satellite data gathered on non-farmland as well.
According to O’Connor, the OpenET has been working on applications for the last four years, but just went live in October. Data goes back only to 2016, though O’Connor said the team is working with archived data to include the entire satellite sensor record going back to 1985. The OpenET team is also working to create an application programming interface (API) that will allow OpenET data to talk with other apps and programs.
Which could make OpenET an important tool in managing water.
“We’ve heard from some companies that are interested in incorporating open up into their irrigation management tools,” O’Connor said. “By being able to easily access the data from OpenET, we’re hopeful that this can be just one more additional data point to help them make informed decisions.”
Charles H. Featherstone can be reached at [email protected].


